Mastering Pie Charts in Microsoft Word for Mac: A Step-by-Step Guide
Do you want to visually represent data in your documents easily? Pie charts can help. How do I create a design in Microsoft Word for Mac?
This guide will teach you everything you need to know about creating pie charts in Microsoft Word for Mac. We can help you if you need anything from inserting and customizing to formatting options and troubleshooting.
As we will see, you will learn how to create beautiful pie charts using Microsoft Word for Mac.
Creating a New Document
When embarking on the journey of crafting compelling documents on Microsoft Word for Mac, the initial step is to seamlessly initiate a new document. The process begins with the simple yet crucial task of opening Microsoft Word on your Mac device. With a swift click on the application icon or a quick search through the Spotlight feature, the familiar interface of Microsoft Word gracefully emerges, ready to serve as your canvas for creativity. Once inside the realm of Word, the next logical move is to kickstart a new document, laying the foundation for your literary masterpiece or professional report. This can be effortlessly achieved by navigating to the “File” menu, where a plethora of options awaits, including the all-important “New Document” command. A single click on this command launches a pristine blank canvas, eagerly awaiting your thoughts, ideas, and inspirations to breathe life into its digital realm.
As you embark on this journey of document creation, it’s essential to harness the power of organization and structure. Utilizing bullet points or numbered lists can aid in presenting information in a clear and concise manner, enhancing readability and comprehension for your audience. Whether outlining key points, delineating steps in a process, or itemizing important details, the judicious use of lists can elevate the effectiveness of your document, guiding readers through complex concepts with ease.
Streamlining the Process
Streamlining the process of creating a new document not only saves time but also fosters efficiency and productivity. With Microsoft Word for Mac, users can leverage built-in templates to jumpstart their projects, offering a wide array of pre-designed layouts tailored to various document types and purposes. From resumes and newsletters to brochures and reports, these templates serve as invaluable starting points, providing a solid framework for customization and personalization.
Unlocking Creative Potential
Beyond the practicalities of document creation lies a realm of boundless creative potential waiting to be unlocked. With Microsoft Word for Mac’s robust suite of formatting tools and design features, users have the freedom to customize every aspect of their documents, from fonts and colors to margins and spacing. Whether aiming for a sleek and professional aesthetic or a playful and vibrant vibe, the flexibility offered by Word empowers users to bring their unique vision to life on the digital page.
In essence, the process of creating a new document on Microsoft Word for Mac transcends mere technicality, embodying the artistry of expression and the precision of organization. By mastering this fundamental step, users pave the way for seamless document creation experiences, where ideas flow freely, and creativity knows no bounds. So, embrace the blank canvas before you, and let your words paint a masterpiece that captivates, informs, and inspires.
Inserting a Pie Chart
To seamlessly integrate a pie chart into your Microsoft Word document on Mac, you’ll need to navigate through a series of intuitive steps. Let’s delve into the process:
- Accessing the “Insert” tab: Begin by launching Microsoft Word on your Mac device. Upon opening a new or existing document, direct your attention to the top toolbar, where you’ll find a series of tabs. Click on the “Insert” tab to unveil a plethora of options for enhancing your document.
- Finding the “Chart” option: Within the “Insert” tab, locate the “Chart” option, typically represented by an icon resembling a graph or chart. This command serves as your gateway to incorporating various types of visual aids, including the coveted pie chart.
- Choosing the “Pie” chart type: After selecting the “Chart” option, a dialog box or dropdown menu will appear, presenting you with a selection of chart types to choose from. Scroll through the options until you spot the illustrious “Pie” chart type, and click on it to proceed.
Streamlining Chart Insertion
Streamlining the process of inserting a pie chart into your document not only saves time but also enhances efficiency, allowing you to focus on crafting compelling content without unnecessary distractions. By familiarizing yourself with the location of essential commands and options within Microsoft Word’s user interface, you can seamlessly navigate through the chart insertion process with confidence and ease.
Customizing Your Pie Chart
Once you’ve successfully inserted a pie chart into your document, the journey doesn’t end there. Microsoft Word offers a plethora of customization options to tailor your chart’s appearance and functionality to suit your specific needs and preferences. From adjusting colors and labels to fine-tuning data representation, harnessing the power of customization empowers you to create visually stunning and informative pie charts that captivate your audience’s attention and convey your message with clarity and impact.
In essence, the process of inserting a pie chart into a Microsoft Word document on Mac epitomizes the marriage of simplicity and sophistication, where intuitive design meets robust functionality to facilitate seamless data visualization experiences. So, embrace the tools at your disposal, and let your pie charts elevate your documents to new heights of professionalism and effectiveness.
Entering Data
When it comes to creating informative and visually appealing pie charts in Microsoft Word for Mac, the process begins with the essential step of entering data into the spreadsheet. Let’s explore how to execute this task effectively:
- Inputting data into the spreadsheet: Start by selecting the spreadsheet area within the chart tool. This action triggers a data table to appear, where you can input your data values. Simply click on each cell and enter the corresponding data point, ensuring accuracy and completeness in your entries. Whether you’re analyzing sales figures, survey responses, or any other dataset, meticulous data entry lays the groundwork for a meaningful and insightful pie chart.
- Adjusting labels and values: Once your data is entered, you may need to refine the labels and values to enhance clarity and comprehension. Microsoft Word provides intuitive options for customizing these elements within the chart tool. Utilize features such as axis labels, data labels, and legend entries to annotate your pie chart with descriptive text and meaningful context. By fine-tuning these details, you can ensure that your audience interprets the chart accurately and gains valuable insights from the presented data.
Maximizing Data Accuracy
In the realm of data visualization, accuracy is paramount. To ensure the integrity of your pie chart, double-check your data inputs for precision and consistency. Verify numerical values for correctness and review labels for relevance and coherence. By prioritizing data accuracy from the outset, you lay a solid foundation for constructing insightful and trustworthy visualizations that resonate with your audience.
Enhancing Visual Clarity
In addition to accurate data entry, optimizing the clarity of your pie chart labels and values enhances the overall effectiveness of your visualization. Consider adjusting font sizes, styles, and colors to improve readability and visual impact. Emphasize key data points with bold or contrasting formatting, guiding viewers’ attention to the most salient insights. By striking the right balance between aesthetics and functionality, you can create pie charts that not only inform but also engage and inspire action.
In essence, entering data into the spreadsheet and adjusting labels and values represent foundational steps in the process of creating compelling pie charts in Microsoft Word for Mac. By mastering these essential tasks with diligence and attention to detail, you set the stage for crafting visualizations that illuminate complex concepts and empower informed decision-making. So, roll up your sleeves, dive into your data, and let your pie charts tell a story that captivates and enlightens your audience.
Customizing the Pie Chart
Customizing your pie chart in Microsoft Word for Mac is key to creating visually compelling and impactful visualizations that effectively convey your data insights. Let’s explore the various customization options available:
- Changing chart design and layout: Microsoft Word offers a range of design options to customize the layout and appearance of your pie chart. Experiment with different chart styles, such as 3D or exploded pie charts, to add depth and dimensionality to your visualization. Additionally, you can adjust the size and position of the chart within your document to optimize visual impact and alignment with surrounding content.
- Adjusting colors and styles: Infuse personality and branding into your pie chart by customizing colors and styles to match your document’s aesthetic or corporate identity. Microsoft Word provides a palette of pre-defined color schemes, or you can create custom color combinations to suit your preferences. Consider using contrasting colors to differentiate data segments and enhance readability, while also ensuring accessibility for all viewers.
- Adding titles and legends: Enhance the clarity and context of your pie chart by incorporating descriptive titles and informative legends. Utilize the chart tools within Microsoft Word to easily add titles above or below the chart, providing viewers with essential context and interpretation guidance. Additionally, include a legend that identifies each data category, ensuring that viewers can accurately interpret the chart without ambiguity.
Maximizing Visual Impact
Customizing your pie chart’s design and layout is more than just a stylistic choice—it’s an opportunity to maximize visual impact and engagement. By selecting design elements that resonate with your audience and reinforce your message, you can elevate your chart from a mere data visualization to a compelling storytelling tool that captivates and informs.
Ensuring Accessibility and Inclusivity
In the quest for customization, it’s essential to prioritize accessibility and inclusivity. Choose color combinations that provide sufficient contrast for viewers with visual impairments, and ensure that text labels are clear and legible for all readers. By embracing universal design principles, you can create pie charts that are accessible to diverse audiences and convey your data insights effectively to everyone.
In essence, customizing your pie chart in Microsoft Word for Mac offers endless possibilities for creativity and expression. Whether you’re crafting a professional report, a persuasive presentation, or an informative infographic, harnessing the power of customization enables you to tailor your visualizations to suit your unique message and audience. So, dive into the customization options available, unleash your creativity, and watch as your pie charts transform from mere data points into impactful visual stories that resonate with your audience.
Formatting Options

Customizing the formatting of your pie chart in Microsoft Word for Mac allows you to fine-tune its appearance and ensure that it aligns seamlessly with your document’s overall aesthetic and message. Let’s delve into the various formatting options available:
- Exploring formatting options for chart elements: Microsoft Word offers a wealth of formatting options for each individual element of your pie chart. From data labels and axis titles to chart titles and legends, you have the flexibility to customize fonts, colors, sizes, and styles to enhance clarity and visual appeal. Dive into the chart formatting dialog box to explore the full range of options available, allowing you to tailor each element to your specific preferences and requirements.
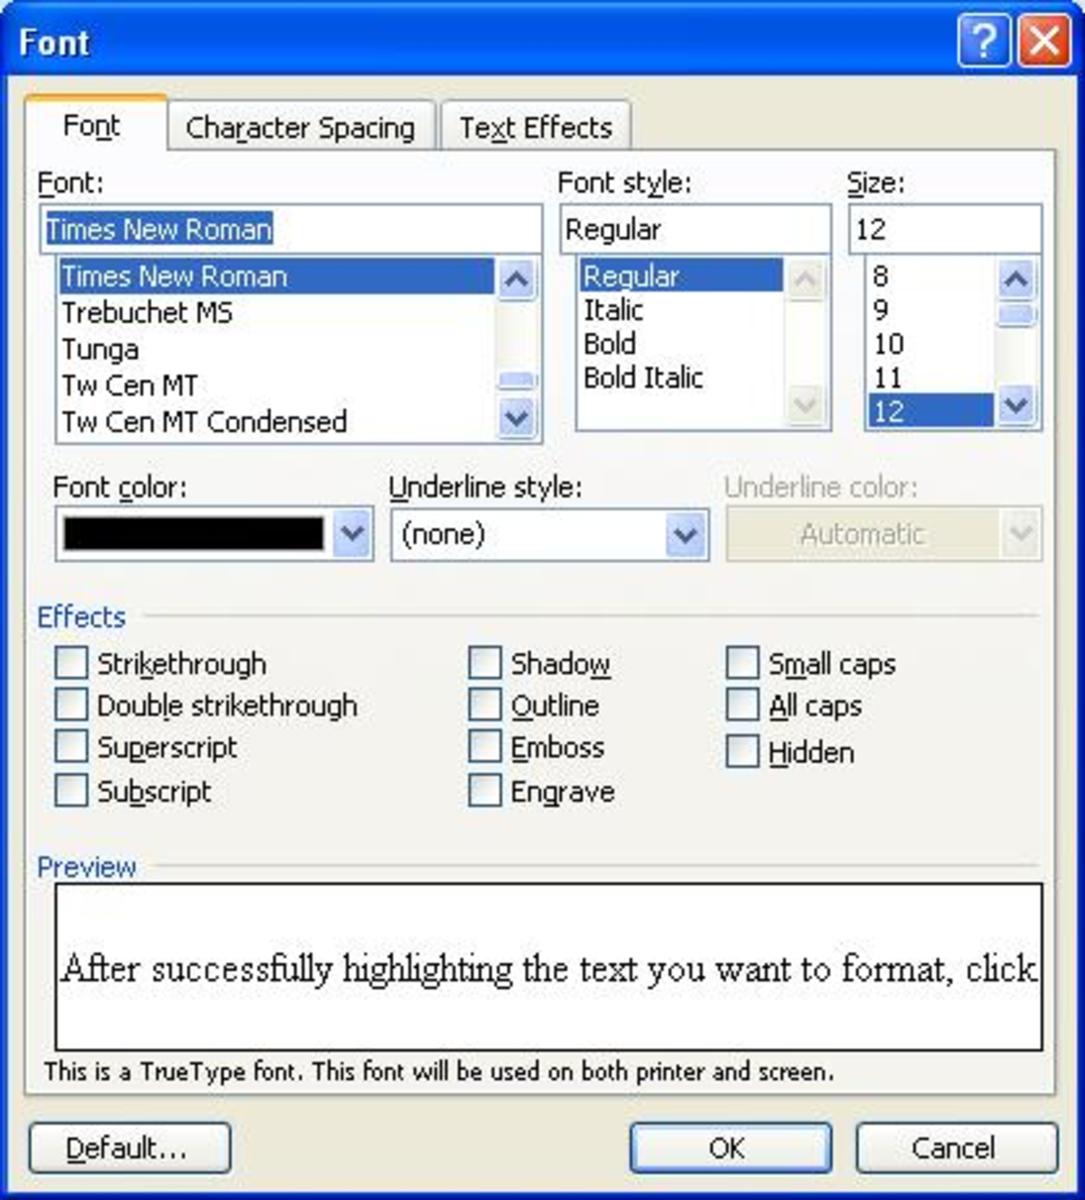
- Adjusting font styles and sizes: One of the most impactful ways to customize your pie chart is by adjusting font styles and sizes. Experiment with different font families, such as Arial, Times New Roman, or Calibri, to find a style that complements your document’s typography. Additionally, vary font sizes to emphasize key elements of the chart, such as titles, labels, and data values, ensuring that important information stands out and grabs the viewer’s attention.
- Changing background and border colors: In addition to font formatting, you can also modify the background and border colors of your pie chart to create visual contrast and emphasis. Choose background colors that complement your document’s color scheme while ensuring that data segments remain clearly visible and distinct. Likewise, experiment with border colors to frame the chart and add a polished finishing touch to your visualization.
Enhancing Visual Cohesion
By exploring the myriad formatting options available for pie charts in Microsoft Word for Mac, you can achieve visual cohesion and consistency across your document. Consistent font styles, sizes, and colors create a sense of harmony and professionalism, guiding the viewer’s eye through the chart with ease and clarity.
Emphasizing Key Insights
Effective formatting isn’t just about aesthetics—it’s also about conveying information efficiently and effectively. By strategically adjusting font styles, sizes, and colors, you can draw attention to key insights and data points within your pie chart, ensuring that viewers grasp the most important information at a glance.
Fine-Tuning the Chart
Fine-tuning your pie chart in Microsoft Word for Mac is essential to ensure its effectiveness and seamless integration within your document. Let’s explore the process of fine-tuning the chart with precision and finesse:
- Editing data labels: Data labels provide crucial context and clarity to your pie chart, allowing viewers to understand the significance of each data segment. With Microsoft Word’s intuitive editing tools, you can easily modify data labels to enhance readability and relevance. Adjust font styles, sizes, and colors to ensure that labels stand out against the background of the chart, and consider adding descriptive text to provide additional insights into the data.
- Resizing and positioning the chart: Achieving optimal chart size and placement within your document is essential for visual balance and readability. Use the resizing handles to adjust the dimensions of the chart to your desired specifications, ensuring that it neither overwhelms nor gets lost amidst other content. Additionally, leverage Microsoft Word’s alignment tools to position the chart precisely within the document, aligning it with surrounding text and graphics for a cohesive and professional appearance.
- Aligning with document content: Seamlessly integrating the pie chart with the rest of your document content enhances overall coherence and impact. Ensure that the chart’s visual style and formatting align with the document’s overall design aesthetic, maintaining consistency and reinforcing your message. Consider incorporating the chart within relevant sections of the document, strategically highlighting key insights and supporting data points to augment comprehension and engagement.
Enhancing Visual Clarity
Fine-tuning the chart goes beyond mere aesthetics—it’s about optimizing visual clarity and impact. By meticulously editing data labels, resizing, and positioning the chart, and aligning it with document content, you can create a visual representation that effectively communicates your message and resonates with your audience.
Ensuring Seamless Integration
The key to fine-tuning the chart lies in its seamless integration within the broader context of your document. By aligning visual elements with document content and design principles, you create a cohesive and compelling narrative that captivates and informs your audience, elevating the overall effectiveness and professionalism of your work.
Saving and Exporting
When it comes to working with pie charts in Microsoft Word for Mac, the final steps involve saving your document and exporting the chart for use in other applications. Let’s delve into these crucial tasks:
- Saving the document: After meticulously crafting your document and pie chart, it’s essential to save your work to ensure that your efforts are preserved. Utilize Microsoft Word’s “Save” function to store your document locally on your Mac or choose cloud storage options such as OneDrive or Dropbox for added security and accessibility. Be sure to give your file a descriptive name and select an appropriate file format, such as .docx or .pdf, to facilitate easy sharing and future editing.
- Exporting the chart for use in other applications: If you intend to incorporate your pie chart into presentations, reports, or other projects beyond Microsoft Word, exporting the chart is necessary. Fortunately, Microsoft Word offers seamless export options that allow you to save the chart as an image file, such as .png or .jpg, for universal compatibility with various applications and platforms. Simply right-click on the chart, select “Save as Picture,” and choose your desired file format and destination folder.
Preserving Your Work
Saving your document ensures that your hard work and creative endeavors are safeguarded against unforeseen circumstances. By adopting a regular saving routine and leveraging cloud storage solutions, you can minimize the risk of data loss and maintain peace of mind knowing that your documents are securely backed up and accessible whenever you need them.
Enhancing Cross-Application Compatibility
Exporting your pie chart for use in other applications extends its utility and versatility, allowing you to leverage your visualizations across a diverse range of projects and platforms. Whether you’re crafting a PowerPoint presentation, designing a brochure in Adobe InDesign, or compiling a data analysis report in Microsoft Excel, exporting the chart as an image file ensures seamless integration and consistent visual representation across different software environments.
Tips and Tricks

Unlock the full potential of pie chart creation in Microsoft Word for Mac with these invaluable tips and tricks designed to streamline your workflow and enhance your productivity:
- Keyboard shortcuts for faster chart creation: Mastering keyboard shortcuts is the secret weapon of efficient chart creation. Familiarize yourself with essential shortcuts such as Command + Shift + K to insert a new chart, Command + Shift + F to open the chart formatting dialog, and Command + C to copy the chart for easy duplication. By incorporating these shortcuts into your workflow, you can accelerate the chart creation process and work more seamlessly within Microsoft Word.
- Utilizing templates for consistent chart design: Consistency is key to professional-looking documents, and templates offer a convenient solution for maintaining uniform chart design across multiple projects. Explore Microsoft Word’s extensive library of chart templates or create custom templates tailored to your specific needs and preferences. By leveraging templates, you can streamline the chart design process, ensure brand consistency, and save valuable time on repetitive tasks.
Boosting Efficiency with Shortcuts
Harnessing the power of keyboard shortcuts is a game-changer for chart creation efficiency. With just a few keystrokes, you can perform complex actions with ease, saving time and minimizing manual effort. Incorporate shortcuts into your workflow to unlock new levels of productivity and streamline your chart creation process like never before.
Ensuring Consistency with Templates
Templates are the cornerstone of consistent chart design, providing a framework for cohesive and professional-looking visualizations. By adopting templates, you can maintain brand consistency, adhere to corporate design guidelines, and ensure that your charts convey information effectively and accurately across all your documents. Invest time in creating or selecting templates that align with your aesthetic preferences and workflow requirements, and reap the benefits of streamlined chart design and enhanced productivity.
Troubleshooting

Encountering issues while working with pie charts in Microsoft Word for Mac can be frustrating, but fear not—here are some common problems and their solutions to help you troubleshoot like a pro:
- Common issues and their solutions: One common issue users face is difficulty in resizing or formatting the pie chart to their liking. If you find yourself struggling with chart dimensions or appearance, try selecting the chart and adjusting the sizing handles to resize it accordingly. Additionally, explore the formatting options available in Microsoft Word to customize the chart’s design and layout to better suit your needs.
- Dealing with compatibility problems: Another challenge that users may encounter is compatibility issues when sharing or exporting documents containing pie charts. If you encounter compatibility problems, such as charts appearing distorted or not displaying correctly in other applications, consider exporting the chart as an image file and inserting it into the document as a picture. This can help ensure seamless compatibility across different platforms and applications.
Solving Chart-related Challenges
Navigating troubleshooting challenges with pie charts requires a combination of patience and problem-solving skills. By understanding common issues and their solutions, you can tackle chart-related challenges with confidence and efficiency, ensuring smooth sailing in your document creation process.
Ensuring Seamless Compatibility
Compatibility problems can be a headache, but with the right approach, you can overcome them effortlessly. By taking proactive steps such as exporting charts as image files and optimizing document formatting, you can minimize compatibility issues and ensure that your charts display flawlessly across various platforms and applications.
Mastering Pie Charts in Microsoft Word for Mac: A Step-by-Step Guide – Conclusion
In conclusion, learning how to create pie charts in Microsoft Word for Mac opens up a whole new world of possibilities for the visually impaired. The step-by-step guide will assist you in rapidly inserting, customizing, and formating pie charts into your documents.
We must practice in order to perfect. Choose the style that best fits your needs by experimenting with different colors, designs, and formatting options. If you encounter any issues during your journey, you should refer to this troubleshooting guide for advice.
You can easily incorporate captivating pie charts into your documents to enhance their visual appeal. Using pie charts in Microsoft Word for Mac makes it simple to present project data, visualize financial trends, or simply add visual interest to your reports. Thank you so much for charting me.


